A team of researchers, affiliated with UNIST has proposed a satellite-aided drought monitoring method that can adequately represent the complex drought conditions into a single integrated drought index. The newly-proposed drought index has attracted considerable attention as a new method for monitoring and forecasting drought hazards due to its accuracy with no space-time constraints.
Drought is one of the most complex natural disasters. Therefore, unlike most other natural disasters, it is usually difficult to define the drought onset or drought declaration. For this reason, various drought indices (i.e., drought severity, the area affected, duration, and timing) are used to monitor drought and its risk management. The existing drought indices are tended to be specific to particular types of drought indicators. Therefore, in order to comprehensively investigate drought disasters, we need a more generalized index that is suitable for varied drought conditions.
Professor Jungho Im and his research team in the Department of Urban and Environmental Engineering at UNIST proposed a new drought monitoring approach with an adaptive index — Vector Projection Analysis (VPA) and Vector Projection Index of Drought (VPID). The new approach is said to consider multiple drought indicators in various climate zones across the Contiguous United States (CONUS) and East Asia. A major advantage of VPA, according to the research team, is that it uses multiple dependent variables (i.e., surface-based drought indices) and multiple independent variables (i.e., satellite-derived drought factors) to capture varied climate and environmental characteristics.

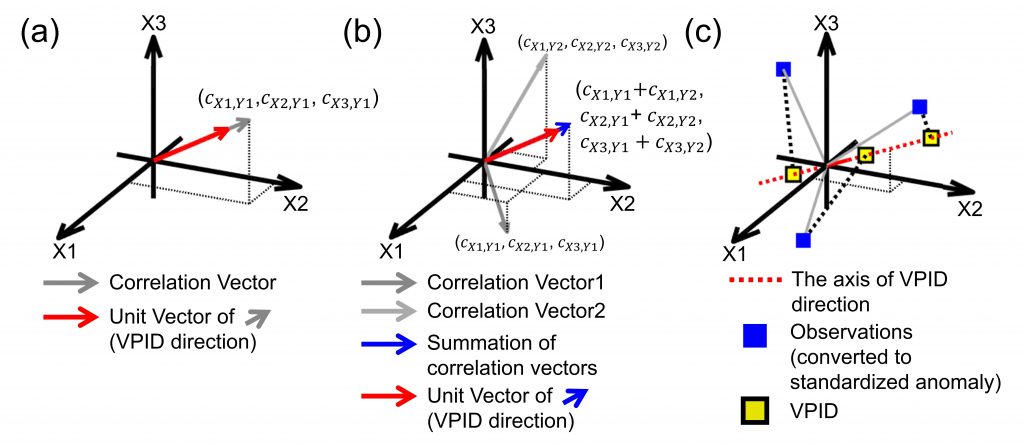
Figure 1. The illustration of VPA with a 3-dimensional case. X1, X2, and X3 represent the axis of the three independent variables. The Correlation Vector has components that consist of correlation coefficients (cXi, Yj) between each independent variable Xi and a dependent variable Yj. Find VPID direction (a) for one dependent variable (i.e., only Y1), (b) for multi-dependent variables (shown with an example of two variables, Y1 and Y2), and (c) calculate VPID.
In this study, three schemes of VPID with different combinations of variables focused on integrated-, short-, and long-term drought (VPIDinte, VPIDshort, and VPIDlong, respectively) were also evaluated over the CONUS and East Asia. According to the research team, all three schemes showed good agreement with both multi-timescale surface-based indices and drought references (USDM and EM-DAT) across the study areas at continental scales.
“This implies that VPA can capture the general trends of multi-drought indices across a wide area with heterogeneous characteristics. Since VPA is a simple method to determine the weight of its calculation under the consideration of multi-dependent variables (i.e., drought indices), it will be helpful to monitor the general characteristics of complex drought conditions in a simple way,” noted the research team.

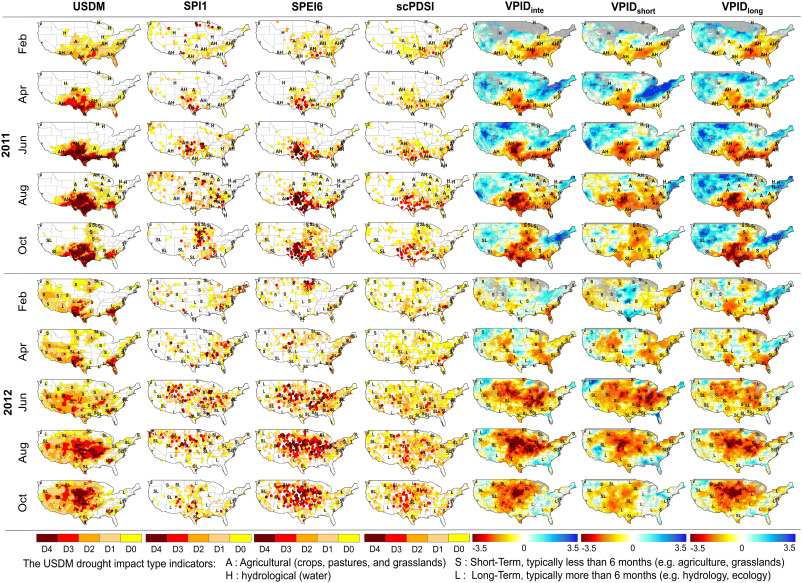
Figure 2. Spatial distribution of VPID schemes, USDM and surface-based drought indices (SPI1, SPEI6, and scPDSI) over the US for 2011–2012 (extreme drought case).
Journal Reference
Bokyung Son, Sumin Park, Jungho Im, et al., “A new drought monitoring approach: Vector Projection Analysis (VPA),” Remote Sensing of Environment, (2021).


